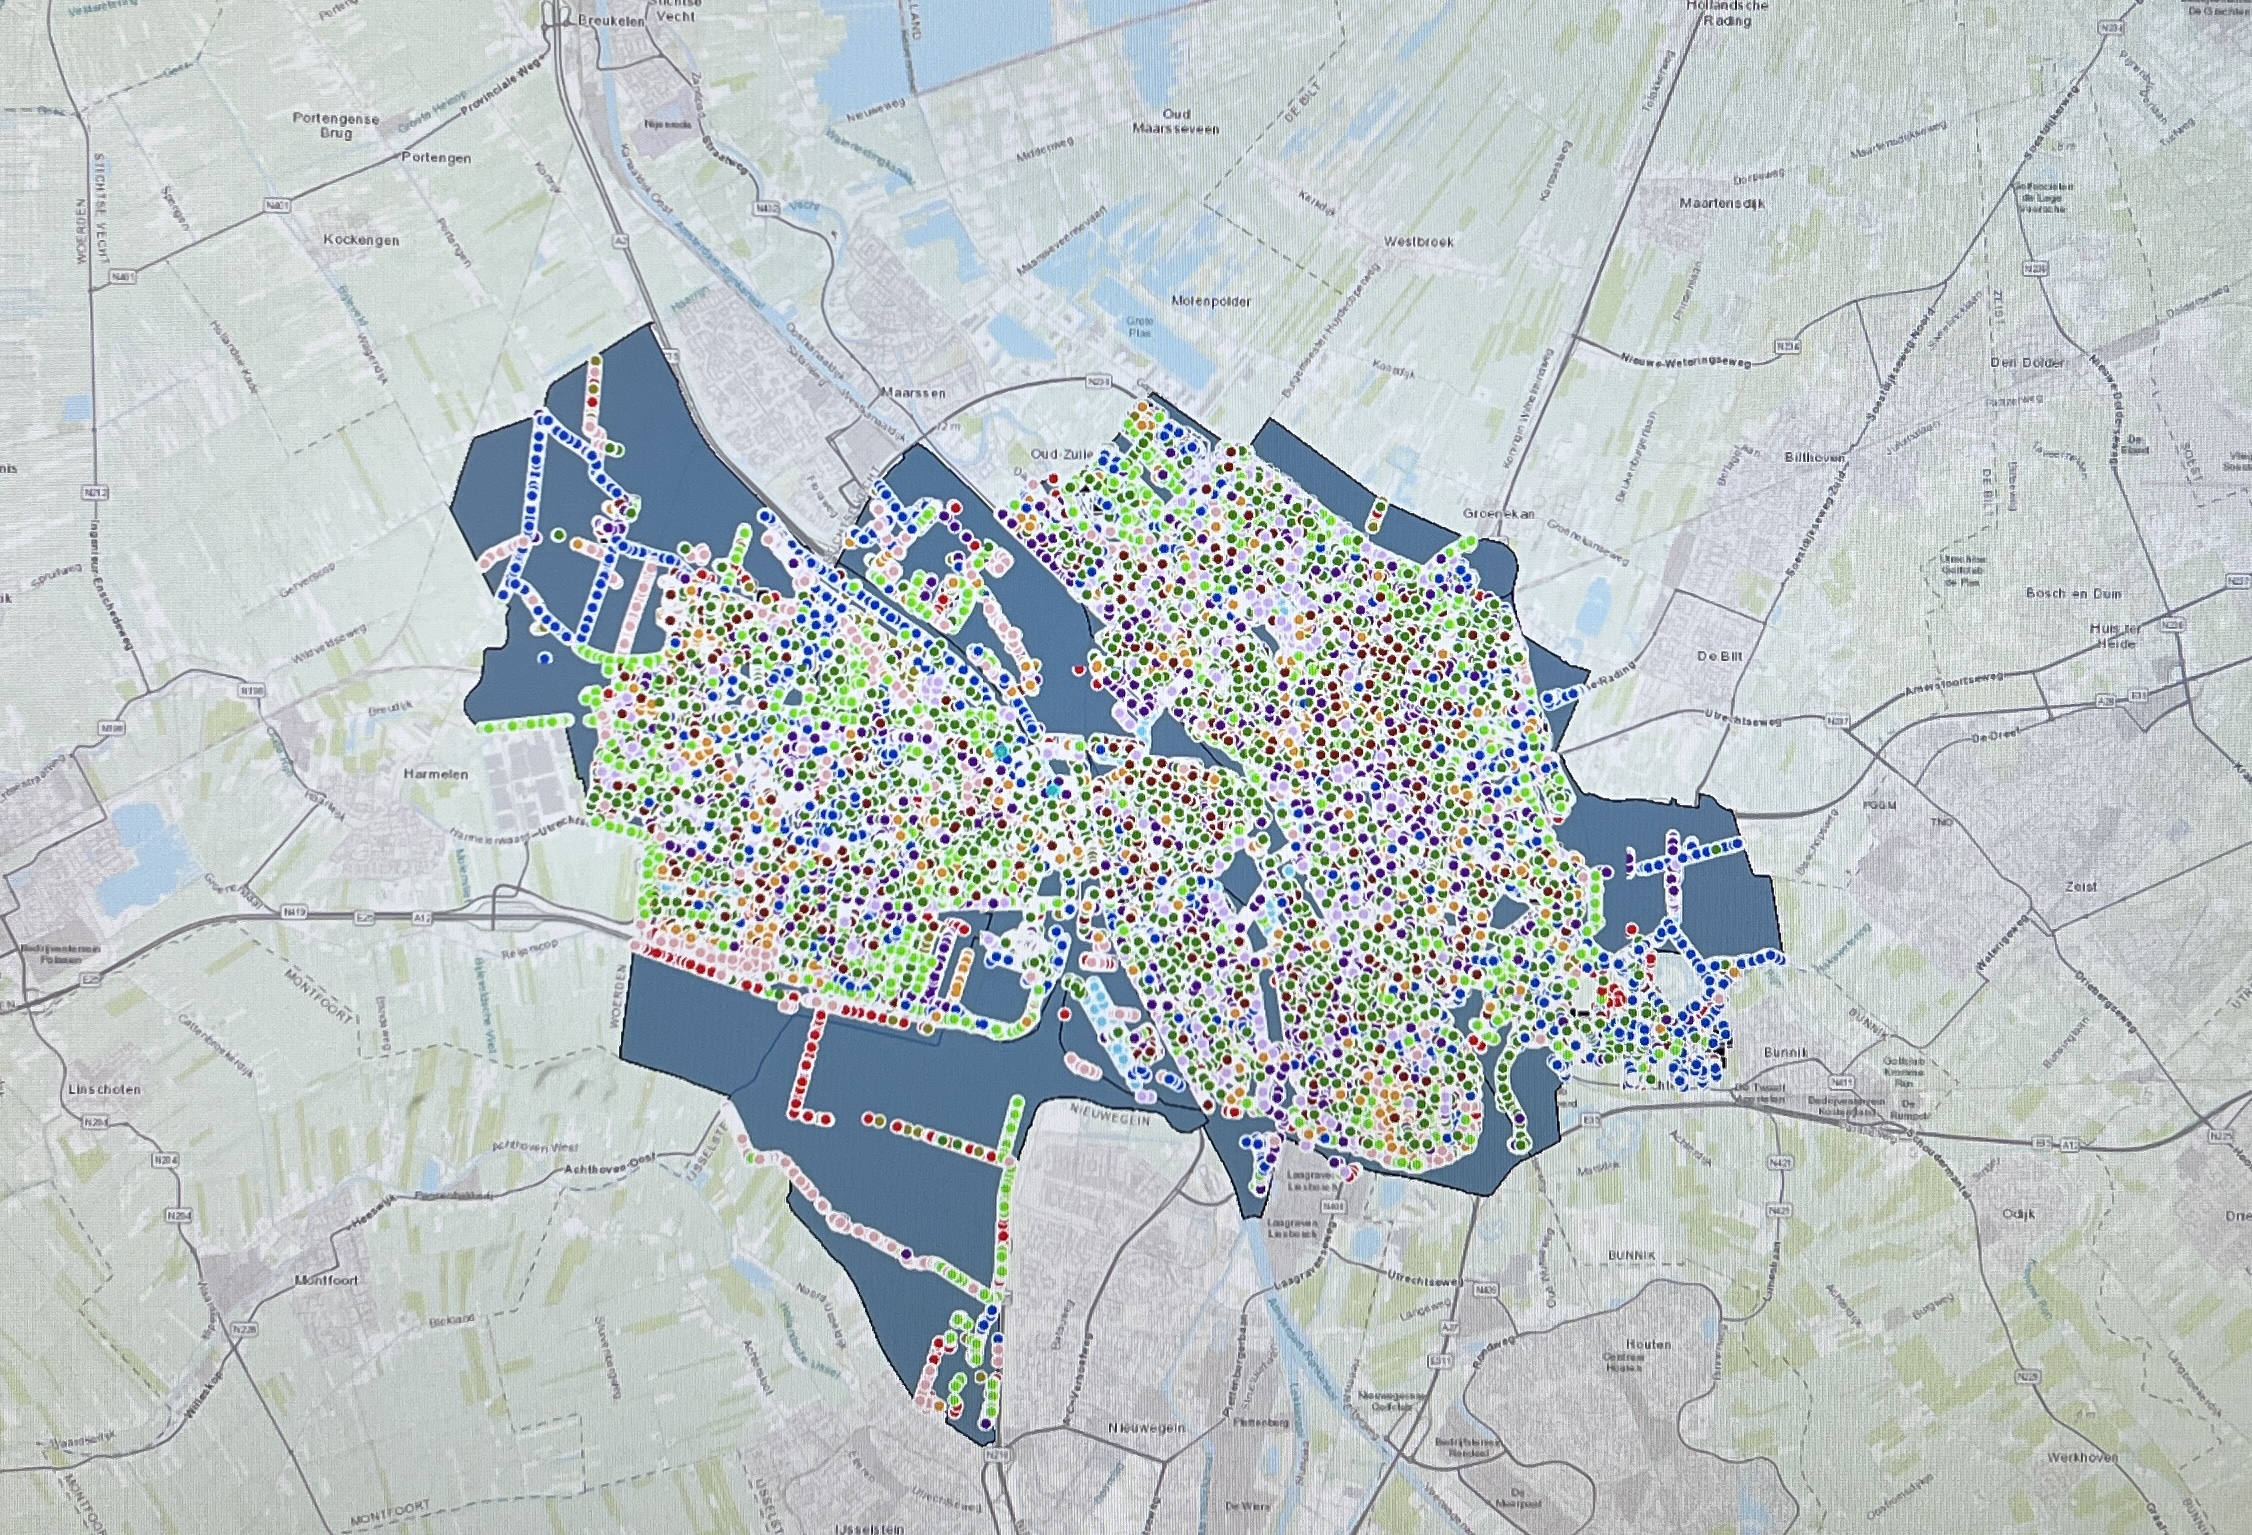
Vector data was used to represent the trees present in Utrecht, the data was collected by the Municipality. Different functions in Arc GIS such as summarize within, kernel density were applied on the map to find concentrations of tress present in each region of utrecht. Furthermore chorelpleth maps were also made to represent this data.
