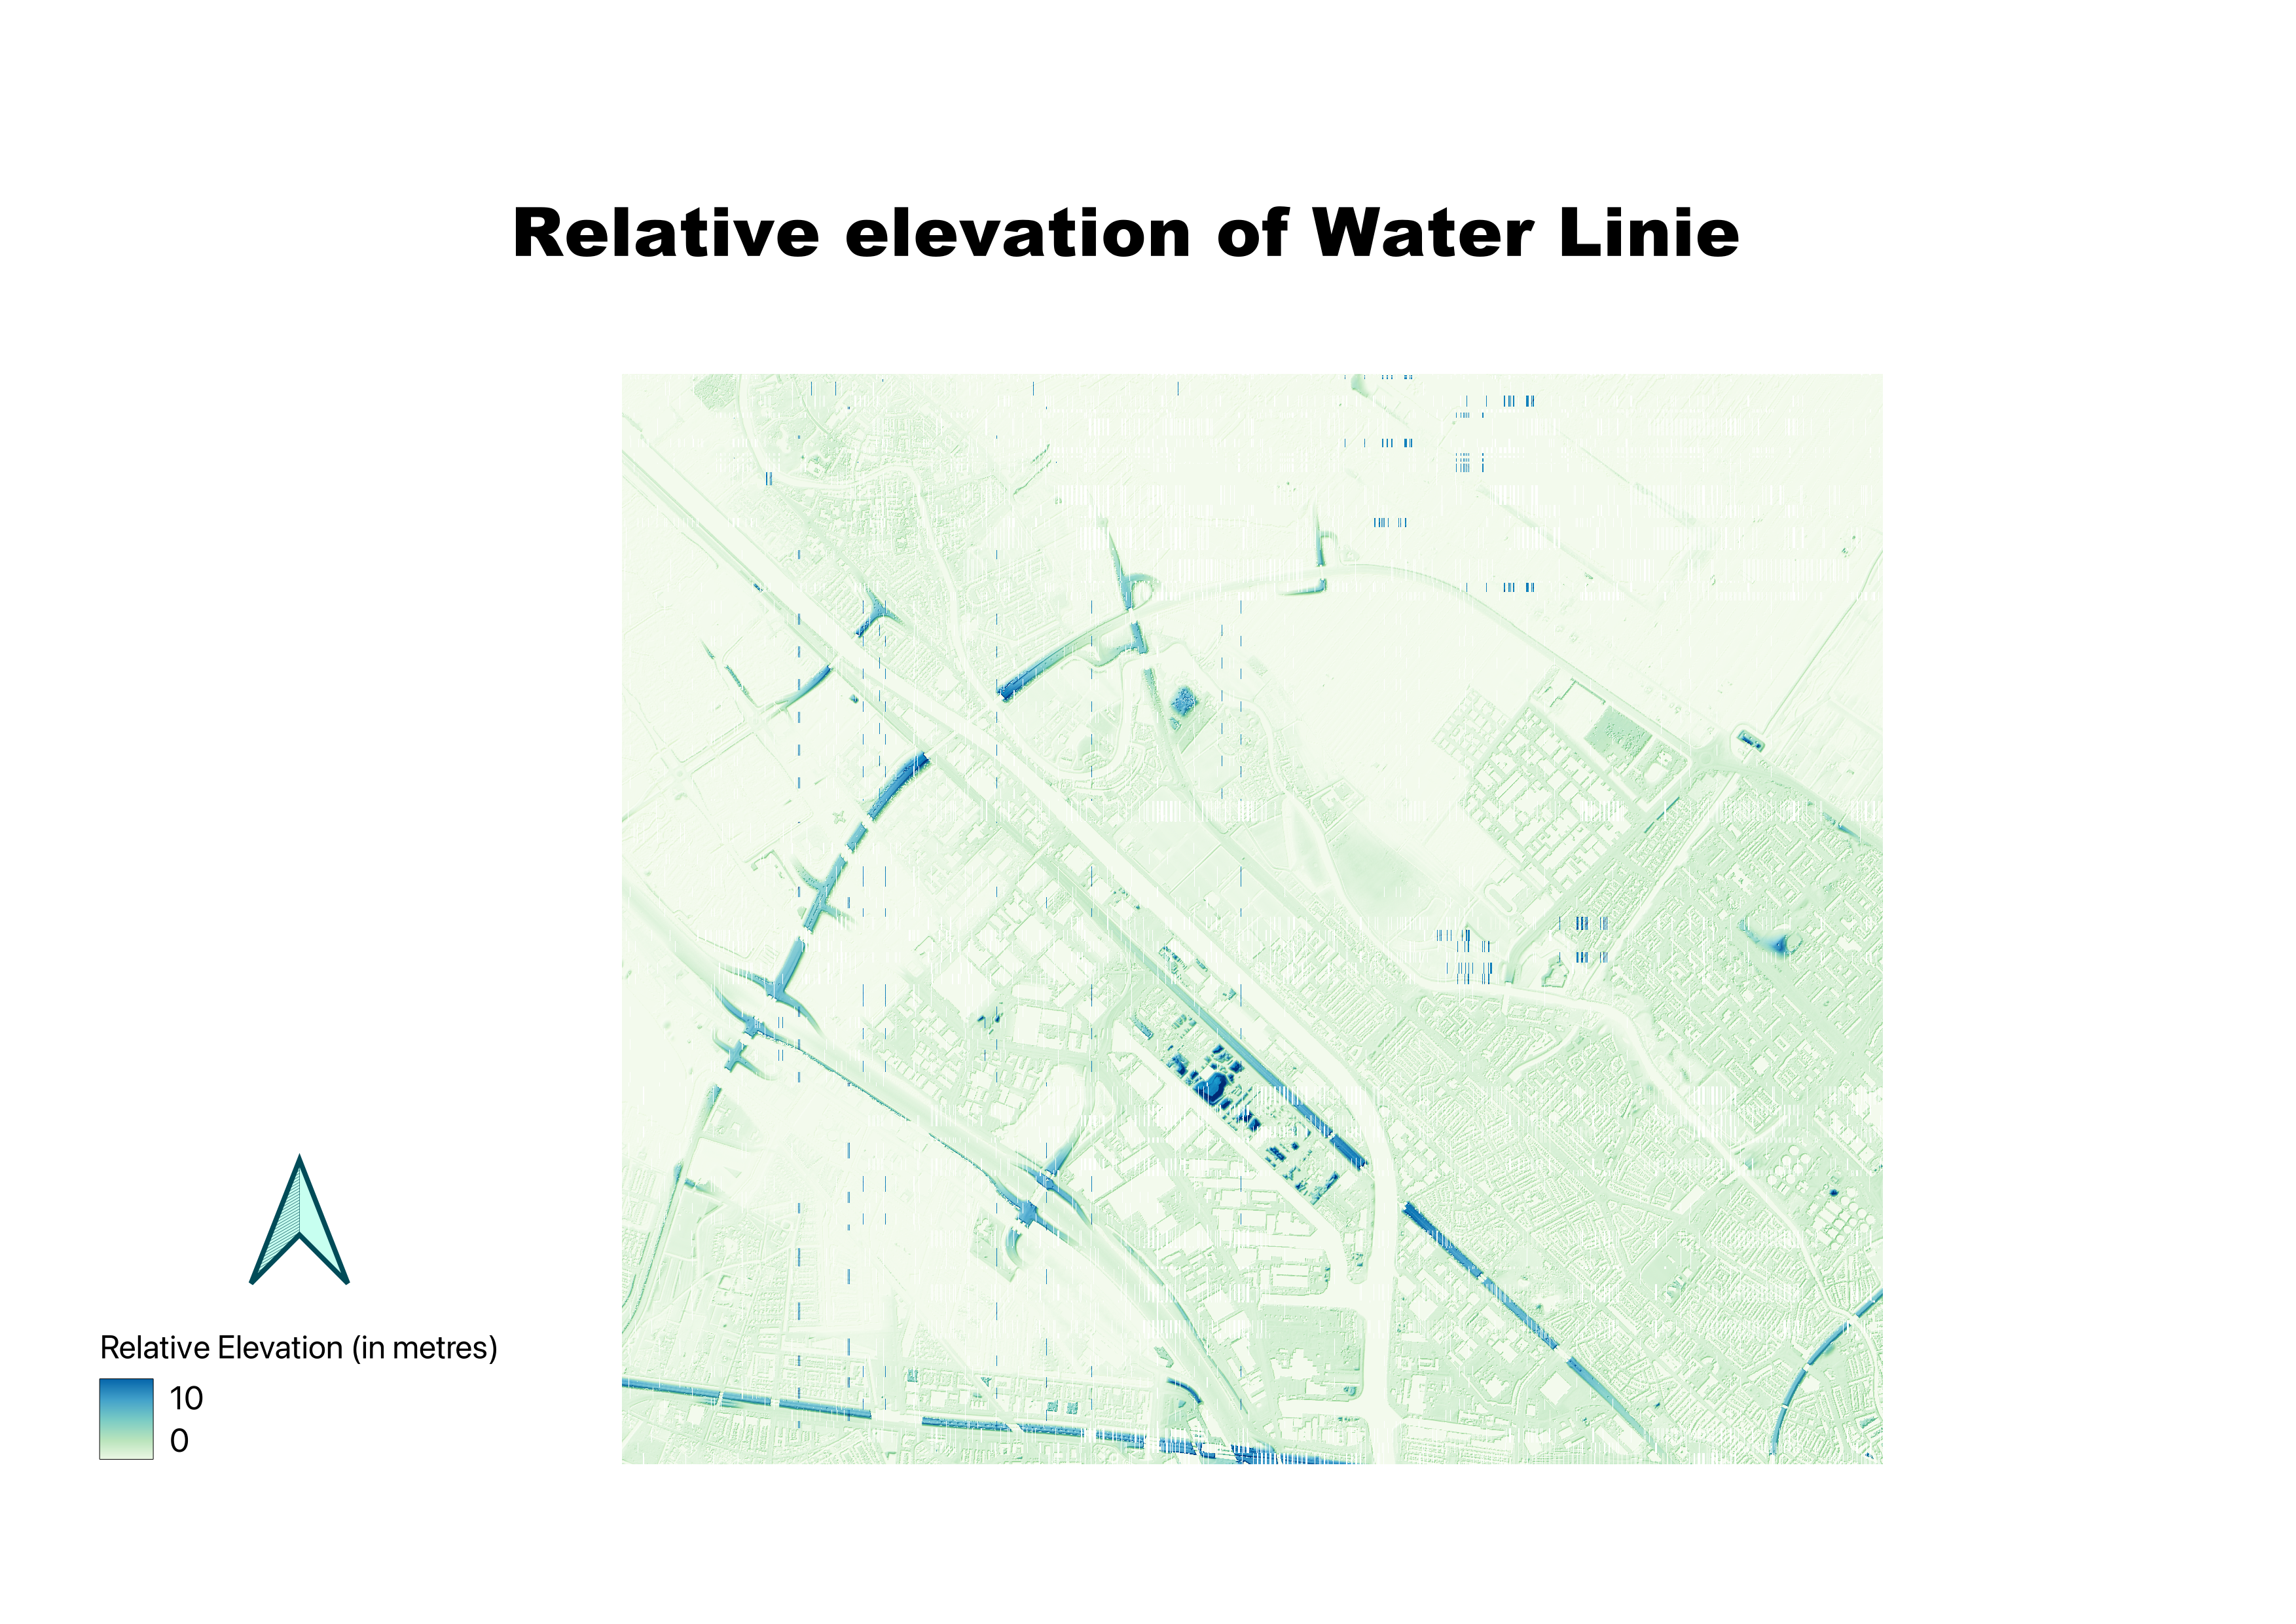
This map represents the region north of Utrecht, the waterlinie present in this region. This region was choosen because, it is interesting to represent the elevation of the surrounding land with respect to the height of the river and since the land of Netherlands is below sea level, it is very interesting to see how dikes and other man-made rised pieces of land are seemingly used to control water flow. As weʼre focusing on the relative elevation of the land surrounding the river, the elevation of the river is taken 0, so I wanted something that takes the river out of the focus, so it is easier to focus on the land which in itself is not much higher than the river itself given it is below sea level. This is why I prefered to represent river with a very light beige colour, on the other hand the land is represented with light green, which I also thought was a good representative colour as most of this region were grasslands. On the other hand, most of the raised land were not natural but manmade, these include dikes, bridges and roads and so on, and I wanted to bring attention to these man made objects and how theyʼre used to control waterflow where ever it is necessary. This is why theyʼre made to look in bright blue in colour.
